Validation
In this example, we will show how to generate an html report to validate the parameter-fitting process.
We begin by generating some synthetic data.
import pybamm
import ionworkspipeline as iwp
import numpy as np
import pandas as pd
import matplotlib.pyplot as plt

# Create a model
model = pybamm.lithium_ion.SPMe()

# Create a parameter set
param = pybamm.ParameterValues("Chen2020")
param["Current function [A]"] = "[input]"
simulation = iwp.Simulation(model, parameter_values=param)

# Solve the model at 3 different current rates, and save the current, voltage, and time data with some noise added to the voltage
synthetic_data = {}
for c_rate in [0.5, 1, 2]:
    sol = simulation.solve(
        np.arange(0, 3000 / c_rate, 100), inputs={"Current function [A]": 5 * c_rate}
    )
    synthetic_data[f"{c_rate} C"] = pd.DataFrame(
        {
            "Time [s]": sol["Time [s]"].entries,
            "Current [A]": sol["Current [A]"].entries,
            "Voltage [V]": sol["Voltage [V]"].entries
            + np.random.randn(len(sol["Time [s]"].entries)) * 0.01,
        }
    )
Run the validation
Begin by creating an objective for each of the sets of interest (in our case, this is the synthetic data). Then, pass it to an ionworks validator object, run the validation, and export the report. Only CurrentDriven is supported for validation at the moment. Summary stats should be a list of ionworkspipeline.calculations.costs objects. The default is RMSE, MAE, and Max. Note that each of these has a scale parameter, which is used to normalize the data. This should be set to 1 to ensure that the data is not scaled.
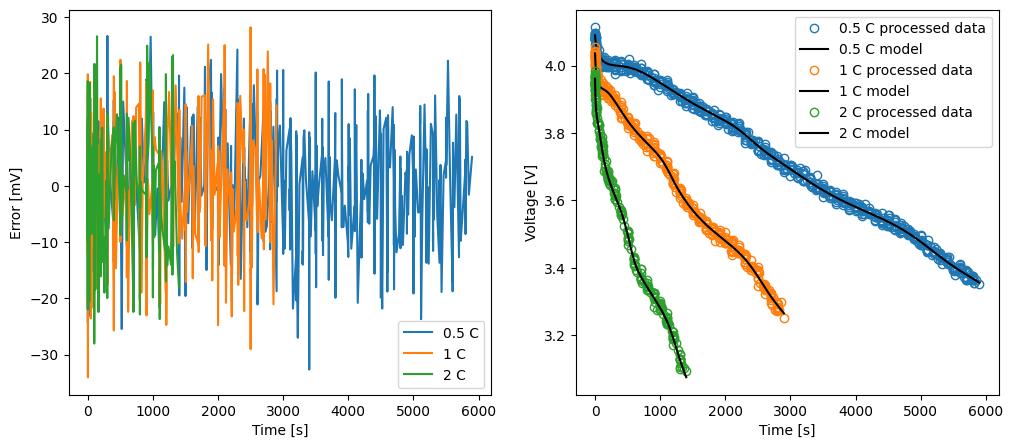
Validation.run takes the parameter values, and returns a dictionary of the validation results and one of the summary statistics. The validation results contains the model and data voltage, current, time, error, and log(error) for each objective. You can plot these results using any plot library, or, as shown in the next cell, use the export_report method to export an html report.
validation_objectives = {}
for name, data in synthetic_data.items():
    validation_objectives[name] = iwp.objectives.CurrentDriven(
        data,
        options={
            "model": model,
        },
    )

# Create a summary stat object
summary_stats = [
    iwp.data_fits.costs.RMSE(scale=1),
    iwp.data_fits.costs.MAE(scale=1),
    iwp.data_fits.costs.Max(scale=1),
]

# Create a validator object
validator = iwp.Validation(validation_objectives, summary_stats=summary_stats)

# Run the validation.
validator.run(param)

# Print the summary statistics by objective. Here is shown the RMSE, MAE, and Max for the 0.5 C objective.
# The RMSE should be around 10 mV given the noise added to the voltage had a standard deviation of 10 mV.
summary_stats = validator.summary_stats
validation_results = validator.validation_results
print(summary_stats["0.5 C"])

fig, ax = plt.subplots(1, 2, figsize=(12, 5))
colors = {
    "0.5 C": "tab:blue",
    "1 C": "tab:orange",
    "2 C": "tab:green",
}
for key in validation_results.keys():
    ax[0].plot(
        validation_results[key]["Time [s]"],
        validation_results[key]["Error [mV]"],
        label=key,
        color=colors[key],
    )
    ax[1].plot(
        validation_results[key]["Time [s]"],
        validation_results[key]["Processed data voltage [V]"],
        "o",
        label=key + " processed data",
        color=colors[key],
        markerfacecolor="none",
    )
    ax[1].plot(
        validation_results[key]["Time [s]"],
        validation_results[key]["Model voltage [V]"],
        label=key + " model",
        color="black",
    )
ax[0].set_xlabel("Time [s]")
ax[0].set_ylabel("Error [mV]")
ax[0].legend()


ax[1].set_xlabel("Time [s]")
ax[1].set_ylabel("Voltage [V]")
ax[1].legend()
plt.show()
[{'name': 'RMSE [mV]', 'metric': 9.849893987842487}, {'name': 'MAE [mV]', 'metric': 7.9250079058005385}, {'name': 'Max Error [mV]', 'metric': 32.64281858132989}]
Export the report
Finally, we can export the report to an html file which can be opened in any browser. You can pass in a list of plots, which can be any combination of “model data”, “error”, and “log error”. Default is “model data” and “error”.
validator.export_report(
    filename="validation_report_synthetic_data.html",
    plots=["model data", "error", "log error"],
)